Europe Security Analytics Market By Application (Web Security Analytics, Network Security Analytics, Endpoint Security Analytics, Application Security Analytics, Others) By Solution Type (Product, Services) By Deployment Type (Cloud Based Security Analytics, On-Premise) By Industry Vertical (Government & Defense, BFSI, Consumer Goods & Retail, IT & Telecom, Healthcare ,Energy & Utilities ,Manufacturing ,Education ,Transport ,Others)
The IT security analytics falls within a broad scope in the security industry. When IT security is implemented smartly, with advanced concepts, it can work as a formidable counter for emerging threats.
Europe Security Analytics Market Overview
The IT security analytics falls within a broad scope in the security industry. When IT security is implemented smartly, with advanced concepts, it can work as a formidable counter for emerging threats. In the real world scenario, if threats are countered in time, counter measures can be implemented to have a secure environment. Despite advanced technologies, a complete mitigation might not be a possibility; however, the intensity of the effect can be contained, if timely acted on emerging threats. Post event analysis can also throw greater light on the possible paths chosen to attack data centers, and a thorough analysis will help in finding the loopholes within the system.
|
Sample Charts |
|
| Europe Security Analytics Market Revenue Trend, 2012-2022 ( In USD Billion) |
Europe Security Analytics Market Growth Trend, 2013-2022 |
 |
 |
|
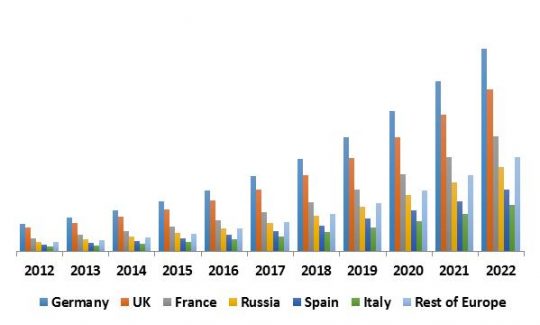
Europe Security Analytics Market Revenue Trend by Country, 2012-2022 ( In USD Billion) |
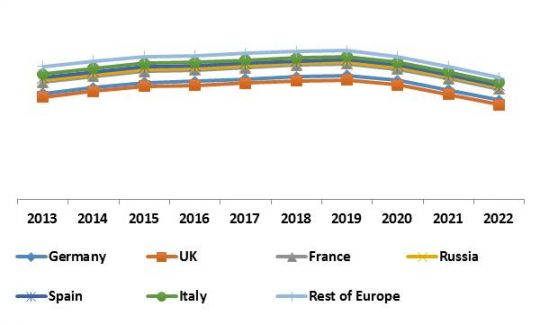
Europe Security Analytics Market Growth Trend by Country, 2013 – 2022 |
 |
 |
|
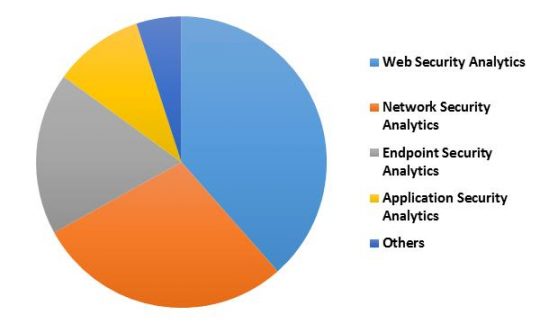
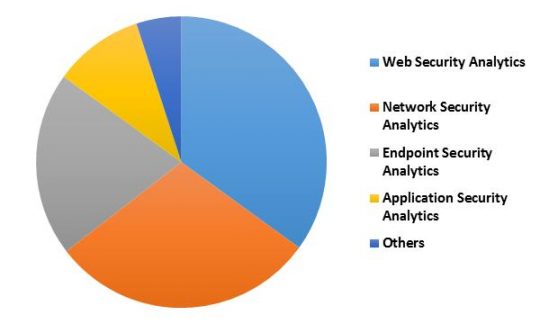
Germany Security Analytics Market Revenue Share by Application– 2015 (in %) |
Germany Security Analytics Market Revenue Share by Application – 2022 (in %) |
 |
|
|
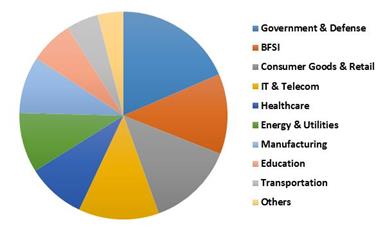
Germany Security Analytics Market Revenue Share by Vertical– 2015 (in %) |
Germany Security Analytics Market Revenue Share by Vertical – 2022 (in %) |
 |
 |
Compliance is becoming a key driver of security requirements for more businesses. With abiding by the government and industry regulations, both large and small corporations are also implementing internal security policies and procedures. To ensure compliance, regulations, policies and procedures are monitored at all levels.
Europe Security Analytics Market Segments
Based on the application type, the Europe Security Analytics market is segmented into web security analytics, network security analytics, endpoint security analytics, application security analytics and others. Web security analytics holds the dominant position in 2015; however, End point security would witness maximum CAGR during the forecast period. Based on the solution type, the security analytics market is segmented into product and services. The services segment is further sub divided into professional and managed security services. The verticals covered within the scope of the report covers government & defense, banking, financial services and insurance (BFSI), retail, telecom and IT, healthcare, manufacturing and other sectors. In 2015, Government & Defense sector dominated the security analytics market by vertical. Based on the deployment type, the Europe Security Analytics market is further segmented across cloud based deployment and on-premise.
Based on country, Europe Security Analytics market is segmented into Germany, UK, France, Russia, Spain, Italy and Rest of Europe. Germany remained the dominant region in the Europe Security Analytics market in 2015. Rest of Europe would witness highest CAGR during the forecast period (2016-2022).
Europe Security Analytics Market Stakeholders
The report covers the analysis of key stake holders of the Security Analytics market. Key companies profiled in the report include IBM Corporation, HP Enterprise Company, FireEye, Inc., Logrhythm, Inc., Alien Vault, Inc., Arbor Networks, Inc. and Blue Coat Systems, Inc.
Europe Security Analytics Market Segmentation:
By Application
- Web Security Analytics
- Network Security Analytics
- Endpoint Security Analytics
- Application Security Analytics
- Others
By Solution Type
- Product
- Services
- Professional
- Managed
By Deployment Type
- Cloud Based Security Analytics
- On-Premise
By Industry Vertical
- Government & Defense
- BFSI
- Consumer Goods & Retail
- IT & Telecom
- Healthcare
- Energy & Utilities
- Manufacturing
- Education
- Transport
- Others
By Country
- Germany
- UK
- France
- Russia
- Spain
- Italy
- Rest of Europe
Companies Profiled
- IBM Corporation
- Cisco Systems, Inc.
- FireEye, Inc.
- HP Enterprise Company
- Logrhythm, Inc.
- Alien Vault, Inc.
- Arbor Networks, Inc.
- Blue Coat Systems, Inc.
Unique Offerings from KBV Research
- Exhaustive coverage of Europe Security Analytics Market
- Highest number of market tables (137 Tables, 128 Pages)
- Unique “Market Research & Analytics Tool” to provide instant comparative analysis within the report
- Subscription based model available
- Free of cost quarterly updates
- Free of cost automatic pdf report generation
- Guaranteed best price
- Assured post sales research support with 10% customization free
Chapter 1. Market Scope & Methodology
1.1 Market Definition
1.2 Objectives
1.3 Market Scope
1.4 Segmentation
1.4.1 Europe Security Analytics Market, by Application
1.4.2 Europe Security Analytics Market, by Solution Type
1.4.3 Europe Security Analytics Market, by Deployment Type
1.4.4 Europe Security Analytics Market, by Vertical
1.4.5 Europe Security Analytics Market, by Country
1.5 Methodology for the research
Chapter 2. Executive Summary
Chapter 3. Market Overview
3.1 Introduction
3.2 Drivers, Restraints and Opportunities
3.2.1 Market Drivers
3.2.2 Market Restraints
Chapter 4. Europe Security Analytics Market by Application
4.1 Introduction
4.2 Europe Web Security Analytics Market by Country
4.3 Europe Network Security Analytics Market by Country
4.4 Europe Endpoint Security Analytics Market by Country
4.5 Europe Application Security Analytics Market by Country
4.6 Europe Other Security Analytics Market by Country
Chapter 5. Europe Security Analytics Market By Solution
5.1 Introduction
5.2 Europe Security Analytics Product Market By Country
5.3 Europe Security Analytics Service Market By Country
5.3.1 Europe Security Analytics Market By Service Type
5.3.1.1 Europe Security Analytics Professional Service Market by Country
5.3.1.2 Europe Security Analytics Managed Service Market by Country
Chapter 6. Europe Security Analytics Market By Deployment
6.1 Introduction
6.2 Europe Cloud Based Security Analytics Market by Country
6.3 Europe On-Premise Security Analytics Market by Country
Chapter 7. Europe Security Analytics Market By Industry
7.1 Introduction
7.2 Europe Government & Defense Security Analytics Market by Country
7.3 Europe BFSI Security Analytics Market by Country
7.4 Europe Consumer Goods & Retail Security Analytics Market by Country
7.5 Europe IT & Telecom Security Analytics Market by Country
7.6 Europe Healthcare Security Analytics Market by Country
7.7 Europe Energy & Utilities Security Analytics Market by Country
7.8 Europe Manufacturing Security Analytics Market by Country
7.9 Europe Education Security Analytics Market by Country
7.10 Europe Transport Security Analytics Market by Country
7.11 Europe Other Security Analytics Market by Country
Chapter 8. Europe Security Analytics Market By Geography
8.1 Introduction
8.2 Germany Security Analytics Market
8.2.1 Germany Security Analytics Market by Application
8.2.2 Germany Security Analytics Market by Solution
8.2.2.1 Germany Security Analytics Market by Services
8.2.3 Germany Security Analytics Market by Deployment
8.2.4 Germany Security Analytics Market by Industry
8.3 UK Security Analytics Market
8.3.1 UK Security Analytics Market by Application
8.3.2 UK Security Analytics Market by Solution
8.3.2.1 UK Security Analytics Market by Services
8.3.3 UK Security Analytics Market by Deployment
8.3.4 UK Security Analytics Market by Industry
8.4 France Security Analytics Market
8.4.1 France Security Analytics Market by Application
8.4.2 France Security Analytics Market by Solution
8.4.2.1 France Security Analytics Market by Services
8.4.3 France Security Analytics Market by Deployment
8.4.4 France Security Analytics Market by Industry
8.5 Russia Security Analytics Market
8.5.1 Russia Security Analytics Market by Application
8.5.2 Russia Security Analytics Market by Solution
8.5.2.1 Russia Security Analytics Market by Services
8.5.3 Russia Security Analytics Market by Deployment
8.5.4 Russia Security Analytics Market by Industry
8.6 Spain Security Analytics Market
8.6.1 Spain Security Analytics Market by Application
8.6.2 Spain Security Analytics Market by Solution
8.6.2.1 Spain Security Analytics Market by Services
8.6.3 Spain Security Analytics Market by Deployment
8.6.4 Spain Security Analytics Market by Industry
8.7 Italy Security Analytics Market
8.7.1 Italy Security Analytics Market by Application
8.7.2 Italy Security Analytics Market by Solution
8.7.2.1 Italy Security Analytics Market by Services
8.7.3 Italy Security Analytics Market by Deployment
8.7.4 Italy Security Analytics Market by Industry
8.8 Rest of Europe Security Analytics Market
8.8.1 Rest of Europe Security Analytics Market by Application
8.8.2 Rest of Europe Security Analytics Market by Solution
8.8.2.1 Rest of Europe Security Analytics Market by Services
8.8.3 Rest of Europe Security Analytics Market by Deployment
8.8.4 Rest of Europe Security Analytics Market by Industry
Chapter 9. Company Profiles
9.1 IBM Corporation
9.1.1 Company Overview
9.1.2 Financial Analysis
9.1.3 Business Segment Analysis
9.1.4 Research and Development Cost
9.2 Microsoft Corporation
9.2.1 Company Overview
9.2.2 Financial Analysis
9.2.3 Business Segment Analysis
9.2.4 Research and Development Cost
9.3 Fujitsu Limited
9.3.1 Company Overview
9.3.2 Financial Analysis
9.3.3 Business Segment Analysis
9.4 FireEye, Inc.
9.4.1 Company Overview
9.4.2 Financial Analysis
9.4.3 Business Segment Analysis
9.4.3.1 Product revenue
9.4.3.2 Subscription and service revenue
9.4.4 Research and Development Cost
9.5 BAE Systems
9.5.1 Company Overview
9.5.2 Financial Analysis
9.5.3 Business Segment Analysis
9.5.3.1 Electronic Systems
9.5.3.2 Cyber & Intelligence
9.5.3.3 Platforms & Services (US)
9.5.3.4 Platforms & Services (UK)
9.5.3.5 Platforms & Services (International)
9.5.4 Research and Development Cost
9.6 HP Enterprise Company
9.6.1 Company Overview
9.6.2 Key Executives
9.6.3 Financial Analysis
9.6.4 Segmental Analysis
9.6.4.1 Enterprise Group
9.6.4.2 Enterprise Services
9.6.4.3 Software
9.6.4.4 Financial Services
9.6.4.5 Corporate Investments
9.6.5 Research & Development
9.7 Logrhythm, Inc.
9.7.1 Company overview
9.8 Alien Vault, Inc.
9.8.1 Company overview
9.9 Oracle Corporation
9.9.1 Company Overview
9.9.2 Financial Analysis
9.9.3 Business Segment Analysis
9.9.3.1 Cloud and On-Premise Software Business
9.9.3.2 Hardware Business
9.9.3.3 Service Business
9.9.4 Research and Development Cost
9.10 Open Text Corporation
9.10.1 Company Overview
9.10.2 Financial Analysis
9.10.3 Business Segment Analysis
9.10.3.1 License Business
9.10.3.2 Cloud Services and Subscriptions
9.10.3.3 Customer Support
9.10.4 Research and Development Cost
List of Tables
TABLE 1 MOST RECENT AND SIGNIFICANT DATA BREACHES OF 2014
TABLE 2 EUROPE SECURITY ANALYTICS MARKET BY APPLICATION, USD MILLION, (2012-2015)
TABLE 3 EUROPE SECURITY ANALYTICS MARKET BY APPLICATION, USD MILLION, (2016-2022)
TABLE 4 EUROPE WEB SECURITY ANALYTICS MARKET BY COUNTRY, USD MILLION, (2012-2015)
TABLE 5 EUROPE WEB SECURITY ANALYTICS MARKET BY COUNTRY, USD MILLION, (2016-2022)
TABLE 6 EUROPE NETWORK SECURITY ANALYTICS MARKET BY COUNTRY, USD MILLION, (2012-2015)
TABLE 7 EUROPE NETWORK SECURITY ANALYTICS MARKET BY COUNTRY, USD MILLION, (2016-2022)
TABLE 8 EUROPE ENDPOINT SECURITY ANALYTICS MARKET BY COUNTRY, USD MILLION, (2012-2015)
TABLE 9 EUROPE ENDPOINT SECURITY ANALYTICS MARKET BY COUNTRY, USD MILLION, (2016-2022)
TABLE 10 EUROPE APPLICATION SECURITY ANALYTICS MARKET BY COUNTRY, USD MILLION, (2012-2015)
TABLE 11 EUROPE APPLICATION SECURITY ANALYTICS MARKET BY COUNTRY, USD MILLION, (2016-2022)
TABLE 12 EUROPE OTHER SECURITY ANALYTICS MARKET BY COUNTRY, USD MILLION, (2012-2015)
TABLE 13 EUROPE OTHER SECURITY ANALYTICS MARKET BY COUNTRY, USD MILLION, (2016-2022)
TABLE 14 EUROPE SECURITY ANALYTICS MARKET BY SOLUTION, USD MILLION (2012-2015)
TABLE 15 EUROPE SECURITY ANALYTICS MARKET BY SOLUTION, USD MILLION (2016-2022)
TABLE 16 EUROPE SECURITY ANALYTICS PRODUCT MARKET BY COUNTRY, USD MILLION, (2012-2015)
TABLE 17 EUROPE SECURITY ANALYTICS PRODUCT MARKET BY COUNTRY, USD MILLION, (2016-2022)
TABLE 18 EUROPE SECURITY ANALYTICS SERVICE MARKET BY COUNTRY, USD MILLION, (2012-2015)
TABLE 19 EUROPE SECURITY ANALYTICS SERVICE MARKET BY COUNTRY, USD MILLION, (2016-2022)
TABLE 20 EUROPE SECURITY ANALYTICS MARKET BY SERVICE TYPE, USD MILLION (2012-2015)
TABLE 21 EUROPE SECURITY ANALYTICS MARKET BY SERVICE TYPE, USD MILLION (2016-2022)
TABLE 22 EUROPE SECURITY ANALYTICS PROFESSIONAL SERVICES MARKET BY COUNTRY, USD MILLION (2012-2015)
TABLE 23 EUROPE SECURITY ANALYTICS PROFESSIONAL SERVICES MARKET BY COUNTRY, USD MILLION (2016-2022)
TABLE 24 EUROPE SECURITY ANALYTICS MANAGED SERVICES MARKET BY COUNTRY, USD MILLION (2012-2015)
TABLE 25 EUROPE SECURITY ANALYTICS MANAGED SERVICES MARKET BY COUNTRY, USD MILLION (2016-2022)
TABLE 26 EUROPE SECURITY ANALYTICS MARKET BY DEPLOYMENT, USD MILLION (2012-2015)
TABLE 27 EUROPE SECURITY ANALYTICS MARKET BY DEPLOYMENT, USD MILLION (2016-2022)
TABLE 28 EUROPE CLOUD BASED SECURITY ANALYTICS MARKET BY COUNTRY, USD MILLION (2012-2015)
TABLE 29 EUROPE CLOUD BASED SECURITY ANALYTICS MARKET BY COUNTRY, USD MILLION (2016-2022)
TABLE 30 EUROPE ON-PREMISE SECURITY ANALYTICS MARKET BY COUNTRY, USD MILLION, (2012-2015)
TABLE 31 EUROPE ON-PREMISE SECURITY ANALYTICS MARKET BY COUNTRY, USD MILLION, (2016-2022)
TABLE 32 EUROPE SECURITY ANALYTICS MARKET BY INDUSTRY, USD MILLION, (2012-2015)
TABLE 33 EUROPE SECURITY ANALYTICS MARKET BY INDUSTRY, USD MILLION, (2016-2022)
TABLE 34 EUROPE GOVERNMENT & DEFENSE SECURITY ANALYTICS MARKET BY COUNTRY, USD MILLION, (2012-2015)
TABLE 35 EUROPE GOVERNMENT & DEFENSE SECURITY ANALYTICS MARKET BY COUNTRY, USD MILLION, (2016-2022)
TABLE 36 EUROPE BFSI SECURITY ANALYTICS MARKET BY COUNTRY, USD MILLION, (2012-2015)
TABLE 37 EUROPE BFSI SECURITY ANALYTICS MARKET BY COUNTRY, USD MILLION, (2016-2022)
TABLE 38 EUROPE CONSUMER GOODS & RETAIL SECURITY ANALYTICS MARKET BY COUNTRY, USD MILLION, (2012-2015)
TABLE 39 EUROPE CONSUMER GOODS & RETAIL SECURITY ANALYTICS MARKET BY COUNTRY, USD MILLION, (2016-2022)
TABLE 40 EUROPE IT & TELECOM SECURITY ANALYTICS MARKET BY COUNTRY, USD MILLION, (2012-2015)
TABLE 41 EUROPE IT & TELECOM SECURITY ANALYTICS MARKET BY COUNTRY, USD MILLION, (2016-2022)
TABLE 42 EUROPE HEALTHCARE SECURITY ANALYTICS MARKET BY COUNTRY, USD MILLION, (2012-2015)
TABLE 43 EUROPE HEALTHCARE SECURITY ANALYTICS MARKET BY COUNTRY, USD MILLION, (2016-2022)
TABLE 44 EUROPE ENERGY & UTILITIES SECURITY ANALYTICS MARKET BY COUNTRY, USD MILLION, (2012-2015)
TABLE 45 EUROPE ENERGY & UTILITIES SECURITY ANALYTICS MARKET BY COUNTRY, USD MILLION, (2016-2022)
TABLE 46 EUROPE MANUFACTURING SECURITY ANALYTICS MARKET BY COUNTRY, USD MILLION, (2012-2015)
TABLE 47 EUROPE MANUFACTURING SECURITY ANALYTICS MARKET BY COUNTRY, USD MILLION, (2016-2022)
TABLE 48 EUROPE EDUCATION SECURITY ANALYTICS MARKET BY COUNTRY, USD MILLION, (2012-2015)
TABLE 49 EUROPE EDUCATION SECURITY ANALYTICS MARKET BY COUNTRY, USD MILLION, (2016-2022)
TABLE 50 EUROPE TRANSPORT SECURITY ANALYTICS MARKET BY COUNTRY, USD MILLION, (2012-2015)
TABLE 51 EUROPE TRANSPORT SECURITY ANALYTICS MARKET BY COUNTRY, USD MILLION, (2016-2022)
TABLE 52 EUROPE OTHER SECURITY ANALYTICS MARKET BY COUNTRY, USD MILLION, (2012-2015)
TABLE 53 EUROPE OTHER SECURITY ANALYTICS MARKET BY COUNTRY, USD MILLION, (2016-2022)
TABLE 54 EUROPE SECURITY ANALYTICS MARKET BY COUNTRY, USD MILLION, (2012-2015)
TABLE 55 EUROPE SECURITY ANALYTICS MARKET BY COUNTRY, USD MILLION, (2016-2022)
TABLE 56 GERMANY SECURITY ANALYTICS MARKET BY APPLICATION, USD MILLION, (2012-2015)
TABLE 57 GERMANY SECURITY ANALYTICS MARKET BY APPLICATION, USD MILLION, (2016-2022)
TABLE 58 GERMANY SECURITY ANALYTICS MARKET BY SOLUTION, USD MILLION, (2012-2015)
TABLE 59 GERMANY SECURITY ANALYTICS MARKET BY SOLUTION, USD MILLION, (2016-2022)
TABLE 60 GERMANY SECURITY ANALYTICS MARKET BY SERVICES, USD MILLION, (2012-2015)
TABLE 61 GERMANY SECURITY ANALYTICS MARKET BY SERVICES, USD MILLION, (2016-2022)
TABLE 62 GERMANY SECURITY ANALYTICS MARKET BY DEPLOYMENT, USD MILLION, (2012-2015)
TABLE 63 GERMANY SECURITY ANALYTICS MARKET BY DEPLOYMENT, USD MILLION, (2016-2022)
TABLE 64 GERMANY SECURITY ANALYTICS MARKET BY INDUSTRY, USD MILLION, (2012-2015)
TABLE 65 GERMANY SECURITY ANALYTICS MARKET BY INDUSTRY, USD MILLION, (2016-2022)
TABLE 66 UK SECURITY ANALYTICS MARKET BY APPLICATION, USD MILLION, (2012-2015)
TABLE 67 UK SECURITY ANALYTICS MARKET BY APPLICATION, USD MILLION, (2016-2022)
TABLE 68 UK SECURITY ANALYTICS MARKET BY SOLUTION, USD MILLION, (2012-2015)
TABLE 69 UK SECURITY ANALYTICS MARKET BY SOLUTION, USD MILLION, (2016-2022)
TABLE 70 UK SECURITY ANALYTICS MARKET BY SERVICES, USD MILLION, (2012-2015)
TABLE 71 UK SECURITY ANALYTICS MARKET BY SERVICES, USD MILLION, (2016-2022)
TABLE 72 UK SECURITY ANALYTICS MARKET BY DEPLOYMENT, USD MILLION, (2012-2015)
TABLE 73 UK SECURITY ANALYTICS MARKET BY DEPLOYMENT, USD MILLION, (2016-2022)
TABLE 74 UK SECURITY ANALYTICS MARKET BY INDUSTRY, USD MILLION, (2012-2015)
TABLE 75 UK SECURITY ANALYTICS MARKET BY INDUSTRY, USD MILLION, (2016-2022)
TABLE 76 FRANCE SECURITY ANALYTICS MARKET BY APPLICATION, USD MILLION, (2012-2015)
TABLE 77 FRANCE SECURITY ANALYTICS MARKET BY APPLICATION, USD MILLION, (2016-2022)
TABLE 78 FRANCE SECURITY ANALYTICS MARKET BY SOLUTION, USD MILLION, (2012-2015)
TABLE 79 FRANCE SECURITY ANALYTICS MARKET BY SOLUTION, USD MILLION, (2016-2022)
TABLE 80 FRANCE SECURITY ANALYTICS MARKET BY SERVICES, USD MILLION, (2012-2015)
TABLE 81 FRANCE SECURITY ANALYTICS MARKET BY SERVICES, USD MILLION, (2016-2022)
TABLE 82 FRANCE SECURITY ANALYTICS MARKET BY DEPLOYMENT, USD MILLION, (2012-2015)
TABLE 83 FRANCE SECURITY ANALYTICS MARKET BY DEPLOYMENT, USD MILLION, (2016-2022)
TABLE 84 FRANCE SECURITY ANALYTICS MARKET BY INDUSTRY, USD MILLION, (2012-2015)
TABLE 85 FRANCE SECURITY ANALYTICS MARKET BY INDUSTRY, USD MILLION, (2016-2022)
TABLE 86 RUSSIA SECURITY ANALYTICS MARKET BY APPLICATION, USD MILLION, (2012-2015)
TABLE 87 RUSSIA SECURITY ANALYTICS MARKET BY APPLICATION, USD MILLION, (2016-2022)
TABLE 88 RUSSIA SECURITY ANALYTICS MARKET BY SOLUTION, USD MILLION, (2012-2015)
TABLE 89 RUSSIA SECURITY ANALYTICS MARKET BY SOLUTION, USD MILLION, (2016-2022)
TABLE 90 RUSSIA SECURITY ANALYTICS MARKET BY SERVICES, USD MILLION, (2012-2015)
TABLE 91 RUSSIA SECURITY ANALYTICS MARKET BY SERVICES, USD MILLION, (2016-2022)
TABLE 92 RUSSIA SECURITY ANALYTICS MARKET BY DEPLOYMENT, USD MILLION, (2012-2015)
TABLE 93 RUSSIA SECURITY ANALYTICS MARKET BY DEPLOYMENT, USD MILLION, (2016-2022)
TABLE 94 RUSSIA SECURITY ANALYTICS MARKET BY INDUSTRY, USD MILLION, (2012-2015)
TABLE 95 RUSSIA SECURITY ANALYTICS MARKET BY INDUSTRY, USD MILLION, (2016-2022)
TABLE 96 SPAIN SECURITY ANALYTICS MARKET BY APPLICATION, USD MILLION, (2012-2015)
TABLE 97 SPAIN SECURITY ANALYTICS MARKET BY APPLICATION, USD MILLION, (2016-2022)
TABLE 98 SPAIN SECURITY ANALYTICS MARKET BY SOLUTION, USD MILLION, (2012-2015)
TABLE 99 SPAIN SECURITY ANALYTICS MARKET BY SOLUTION, USD MILLION, (2016-2022)
TABLE 100 SPAIN SECURITY ANALYTICS MARKET BY SERVICES, USD MILLION, (2012-2015)
TABLE 101 SPAIN SECURITY ANALYTICS MARKET BY SERVICES, USD MILLION, (2016-2022)
TABLE 102 SPAIN SECURITY ANALYTICS MARKET BY DEPLOYMENT, USD MILLION, (2012-2015)
TABLE 103 SPAIN SECURITY ANALYTICS MARKET BY DEPLOYMENT, USD MILLION, (2016-2022)
TABLE 104 SPAIN SECURITY ANALYTICS MARKET BY INDUSTRY, USD MILLION, (2012-2015)
TABLE 105 SPAIN SECURITY ANALYTICS MARKET BY INDUSTRY, USD MILLION, (2016-2022)
TABLE 106 ITALY SECURITY ANALYTICS MARKET BY APPLICATION, USD MILLION, (2012-2015)
TABLE 107 ITALY SECURITY ANALYTICS MARKET BY APPLICATION, USD MILLION, (2016-2022)
TABLE 108 ITALY SECURITY ANALYTICS MARKET BY SOLUTION, USD MILLION, (2012-2015)
TABLE 109 ITALY SECURITY ANALYTICS MARKET BY SOLUTION, USD MILLION, (2016-2022)
TABLE 110 ITALY SECURITY ANALYTICS MARKET BY SERVICES, USD MILLION, (2012-2015)
TABLE 111 ITALY SECURITY ANALYTICS MARKET BY SERVICES, USD MILLION, (2016-2022)
TABLE 112 ITALY SECURITY ANALYTICS MARKET BY DEPLOYMENT, USD MILLION, (2012-2015)
TABLE 113 ITALY SECURITY ANALYTICS MARKET BY DEPLOYMENT, USD MILLION, (2016-2022)
TABLE 114 ITALY SECURITY ANALYTICS MARKET BY INDUSTRY, USD MILLION, (2012-2015)
TABLE 115 ITALY SECURITY ANALYTICS MARKET BY INDUSTRY, USD MILLION, (2016-2022)
TABLE 116 REST OF EUROPE SECURITY ANALYTICS MARKET BY APPLICATION, USD MILLION, (2012-2015)
TABLE 117 REST OF EUROPE SECURITY ANALYTICS MARKET BY APPLICATION, USD MILLION, (2016-2022)
TABLE 118 REST OF EUROPE SECURITY ANALYTICS MARKET BY SOLUTION, USD MILLION, (2012-2015)
TABLE 119 REST OF EUROPE SECURITY ANALYTICS MARKET BY SOLUTION, USD MILLION, (2016-2022)
TABLE 120 REST OF EUROPE SECURITY ANALYTICS MARKET BY SERVICES, USD MILLION, (2012-2015)
TABLE 121 REST OF EUROPE SECURITY ANALYTICS MARKET BY SERVICES, USD MILLION, (2016-2022)
TABLE 122 REST OF EUROPE SECURITY ANALYTICS MARKET BY DEPLOYMENT, USD MILLION, (2012-2015)
TABLE 123 REST OF EUROPE SECURITY ANALYTICS MARKET BY DEPLOYMENT, USD MILLION, (2016-2022)
TABLE 124 REST OF EUROPE SECURITY ANALYTICS MARKET BY INDUSTRY, USD MILLION, (2012-2015)
TABLE 125 REST OF EUROPE SECURITY ANALYTICS MARKET BY INDUSTRY, USD MILLION, (2016-2022)
TABLE 126 KEY INFORMATION
TABLE 127 KEY INFORMATION - MICROSOFT CORPORATION
TABLE 128 KEY INFORMATION - FUJITSU LIMITED
TABLE 129 KEY INFORMATION
TABLE 130 KEY INFORMATION
TABLE 131 HP ENTERPRISE COMPANY SNAPSHOT
TABLE 132 KEY INFORMATION
TABLE 133 PRODUCTS AND SERVICES OFFERED:
TABLE 134 KEY INFORMATION
TABLE 135 PRODUCTS AND SERVICES OFFERED:
TABLE 136 KEY INFORMATION – ORACLE CORPORATION
TABLE 137 KEY INFORMATION – OPEN TEXT CORPORATION

